Swing Path Velocities: How Bat Sensors and Broadcast Replays Illuminate MLB Hitting Patterns
Written by Anna Albrecht · Sep 30, 2026
Swing Path Velocities: How Bat Sensors and Broadcast Replays Illuminate MLB Hitting Patterns
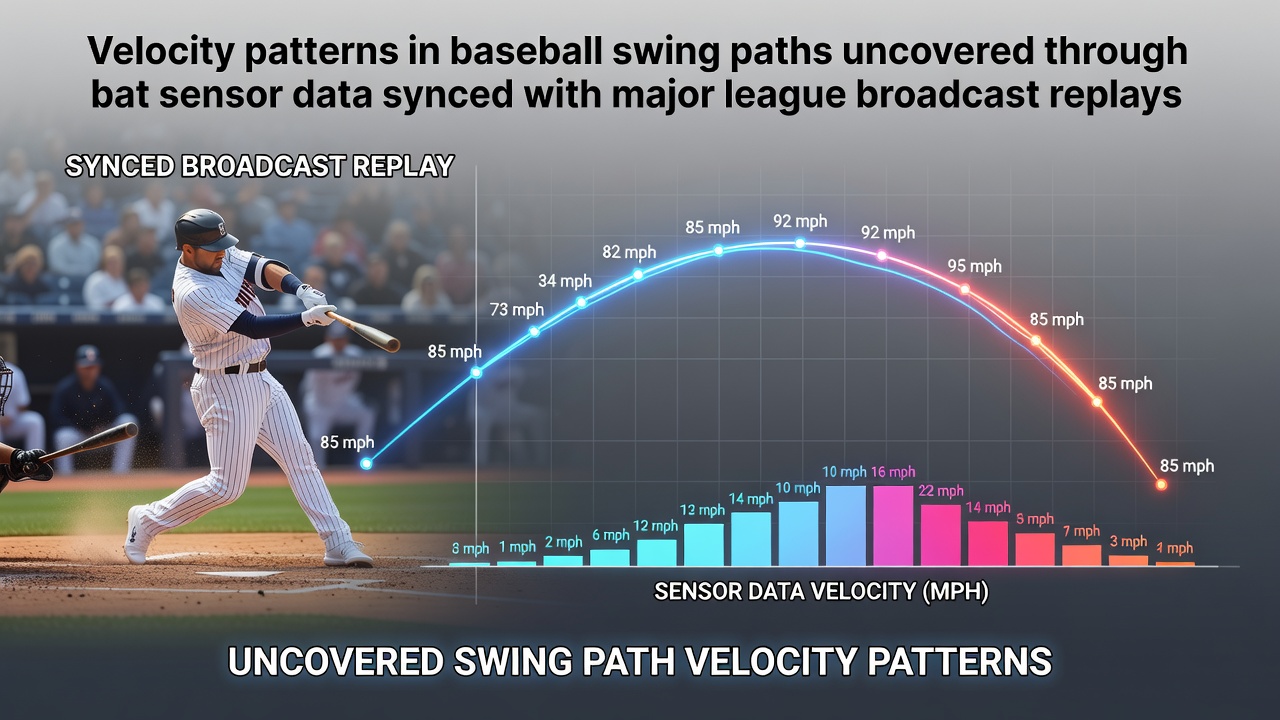
Baseball analysts have turned to bat sensor technology paired with major league broadcast footage to map velocity patterns along swing paths, and the approach has produced detailed datasets that track how bat speed changes from initiation through contact. Researchers collect high-resolution readings from devices attached to bats while synchronizing those readings with frame-by-frame video from network telecasts, which allows precise alignment of peak velocities with specific phases of the swing.
Data Collection Methods Used Across the League
Teams and independent labs place inertial measurement units on bat handles to record linear and angular velocities at rates exceeding one thousand samples per second, and they then match those timestamps to broadcast video that carries official league timing codes. This synchronization process relies on software that detects pitch release and plate crossing moments visible in the footage, after which the system overlays sensor curves onto the visual sequence so analysts can identify where acceleration peaks occur relative to stride foot plant and hip rotation.
Studies conducted through the 2026 season show that average peak bat speeds for qualified hitters range between 70 and 78 miles per hour at the point of contact, while early swing acceleration often reaches its maximum 40 to 60 milliseconds before the ball arrives. Observers note that these figures vary by pitch type, with fastballs producing earlier velocity peaks than breaking pitches because hitters adjust their load timing based on perceived spin and location.
Observed Velocity Patterns in Swing Paths
Patterns emerge when analysts segment swings into distinct zones, and data from multiple clubs indicate that the highest rate of velocity change typically happens during the transition from load to launch. In this phase the bat moves from a near-stationary position into rapid rotation, and sensor readings reveal that successful contact correlates with a smooth acceleration curve rather than abrupt spikes. Broadcast replays from September 2026 games have supplied additional examples where hitters who maintained consistent acceleration through the bottom of the zone recorded higher exit velocities on average.
Another recurring observation involves late-stage deceleration after contact, and measurements show that elite performers reduce bat speed by roughly 15 percent within 30 milliseconds of impact, which helps control follow-through direction. Those who've examined the combined datasets point out that hitters who exhibit excessive post-contact deceleration often produce weaker contact outcomes because energy dissipates too early in the path.
Integration With Broadcast Replays for Validation
Broadcast footage supplies contextual information that raw sensor numbers lack, and analysts use it to confirm whether a recorded velocity spike aligns with visible mechanical events such as shoulder tilt or wrist snap. When the two data streams are locked together, discrepancies become apparent, and technicians can flag instances where sensor drift or video frame drops affect alignment accuracy. Major league clubs have adopted standardized calibration routines that compare sensor output against known high-speed camera benchmarks before each homestand.
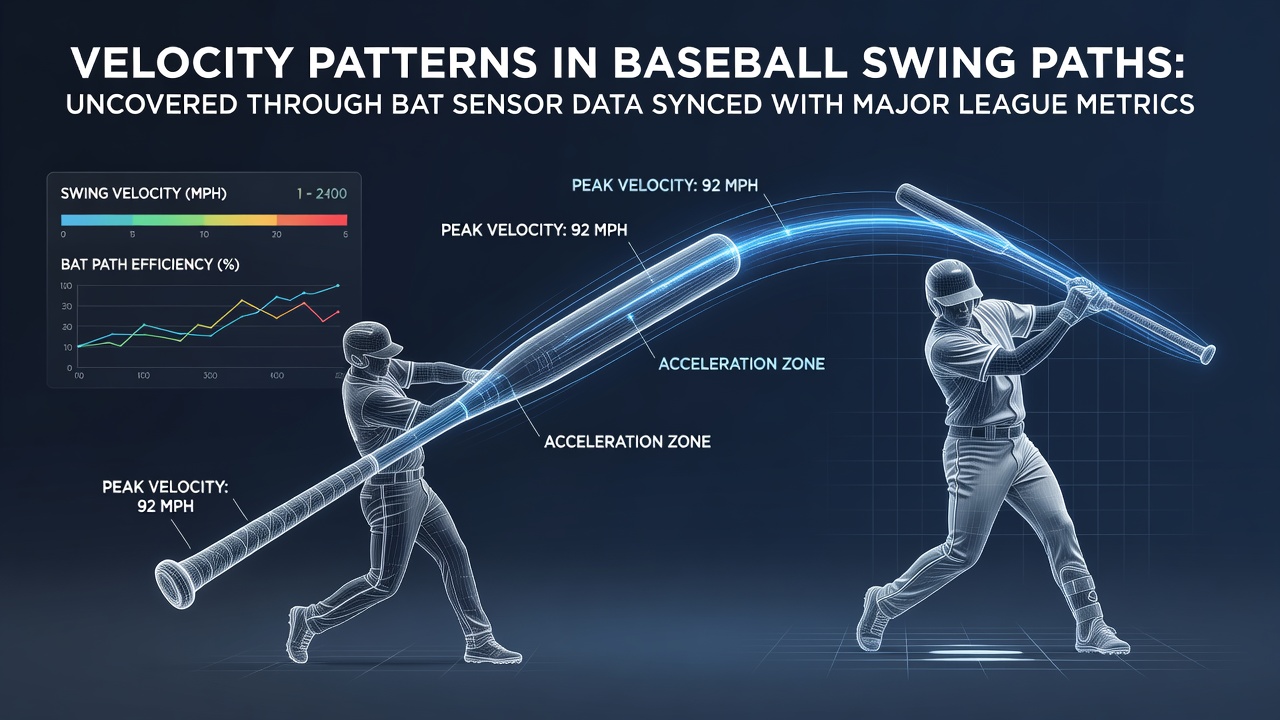
One study released by the American College of Sports Medicine examined over four thousand tracked swings from the first half of the 2026 campaign, and the results indicated that players who adjusted their swing plane mid-path based on pitch trajectory maintained higher average velocities through the impact window. The report also noted regional differences, with National League hitters showing slightly later acceleration peaks than their American League counterparts, a pattern attributed to variations in umpire strike zone enforcement documented in league-wide video reviews.
Training Adjustments Derived From Combined Datasets
Coaches now incorporate velocity curve visualizations into daily drills, and players review synced replays to identify where their acceleration deviates from established benchmarks. Programs that emphasize early torque application have reported measurable gains in peak speed within four to six weeks, according to internal tracking logs shared at industry conferences. Equipment manufacturers have responded by developing lighter sensor housings that reduce added mass while preserving data fidelity, which allows hitters to train under conditions closer to game bats.
Academic researchers affiliated with institutions across North America continue to refine algorithms that predict swing outcomes from early velocity signatures, and preliminary models achieve accuracy rates above 80 percent when forecasting whether a swing will result in solid contact. These efforts draw on data contributed by multiple organizations, including biomechanical labs that maintain open-access repositories for verified swing files.
Future Directions for Velocity Analysis
League officials have begun exploring expanded use of optical tracking systems that complement bat sensors, and integration of these streams promises even finer resolution of path curvature effects on final velocity. As September 2026 draws to a close, several clubs plan to publish aggregated findings that compare in-season adjustments against postseason performance, providing a broader view of how velocity patterns evolve under playoff pressure. Continued collaboration between technology providers and research groups should yield additional insights into the mechanical factors that govern efficient swing production.
Conclusion
The combination of bat sensor measurements and broadcast replay synchronization has established a reliable framework for examining velocity patterns throughout the baseball swing, and ongoing data collection continues to refine understanding of how acceleration profiles relate to contact quality. Teams that systematically apply these analytical tools gain clearer pictures of individual mechanical tendencies, which in turn supports targeted development programs across all levels of the sport.